Problem
A graph whose nodes have all been labeled can be represented by an adjacency list, in which each row of the list contains the two node labels corresponding to a unique edge.
A directed graph (or digraph) is a graph containing directed edges, each of which has an orientation. That is, a directed edge is represented by an arrow instead of a line segment; the starting and ending nodes of an edge form its tail and head, respectively. The directed edge with tail
For a collection of strings and a positive integer
Given: A collection of DNA strings in FASTA format having total length at most 10 kbp.
Return: The adjacency list corresponding to
Sample Dataset
>Rosalind_0498
AAATAAA
>Rosalind_2391
AAATTTT
>Rosalind_2323
TTTTCCC
>Rosalind_0442
AAATCCC
>Rosalind_5013
GGGTGGG
Sample Output
Rosalind_0498 Rosalind_2391
Rosalind_0498 Rosalind_0442
Rosalind_2391 Rosalind_2323
Problem explanation
문제의 조건들은 다음과 같습니다.
1. 비교 하는 대상이 앞에 올때 s, 비교 하는 대상이 뒤에 올때 t로 명명합니다. (이때 s와 t는 같을 수 없습니다.)
2. s의 전체 시퀀스의 뒤에서 k 만큼의 bp(시퀀스 한개 1bp)는 v를 의미하며 t의 전체 시퀀스의 앞에서 k 만큼의 bp를 추출한 것을 w로 판단합니다.
3. v = w 의 조건에 만족한 영역들만 추출합니다.( w = v 일때는 포함되면 안됩니다.)
Source
f = open("D:/gs/rosalind/rosalind_grph.txt","r")
k = 3
lines = f.readlines()
id = []
seq = []
#rosalind 에서 주는 txt 파일을 불러와서 나의 inputdata에 맞게 reform 합니다.
def reform(lines):
    for line in lines:
        if line.startswith(">"):
            a = line.replace(">", "")
            a = a.replace("\n", "")
            id.append(a)
        else:
            if len(id) > len(seq):
                line = line.replace("\n","")
                seq.append(line)
            else:
                line = line.replace("\n", "")
                seq[len(id) - 1] = seq[len(id) - 1] + line
    return id , seq
id, seq = reform(lines)

s = []
t = []

for i in range(len(id)):
    for j in range(len(seq)):

        if i != j:
            if seq[i][-k:] == seq[j][:k]:
                s.append(id[i])
                t.append(id[j])

for i in range(len(s)):
    print(s[i] + " " + t[i])

f.close()
A Brief Introduction to Graph Theory
Networks arise everywhere in the practical world, especially in biology. Networks are prevalent in popular applications such as modeling the spread of disease, but the extent of network applications spreads far beyond popular science. Our first question asks how to computationally model a network without actually needing to render a picture of the network.
First, some terminology: graph is the technical term for a network; a graph is made up of hubs called nodes (or vertices), pairs of which are connected via segments/curves called edges. If an edge connects nodes
- an edge
is incident to nodes and ; we say that and are adjacent to each other; - the degree of
is the number of edges incident to it; - a walk is an ordered collection of edges for which the ending node of one edge is the starting node of the next (e.g.,
, , , etc.); - a path is a walk in which every node appears in at most two edges;
- path length is the number of edges in the path;
- a cycle is a path whose final node is equal to its first node (so that every node is incident to exactly two edges in the cycle); and
- the distance between two vertices is the length of the shortest path connecting them.
Graph theory is the abstract mathematical study of graphs and their properties.
'Python > rosaland' 카테고리의 다른 글
| Finding a Shared Motif (0) | 2018.12.11 |
|---|---|
| Calculating Expected Offspring (0) | 2018.12.07 |
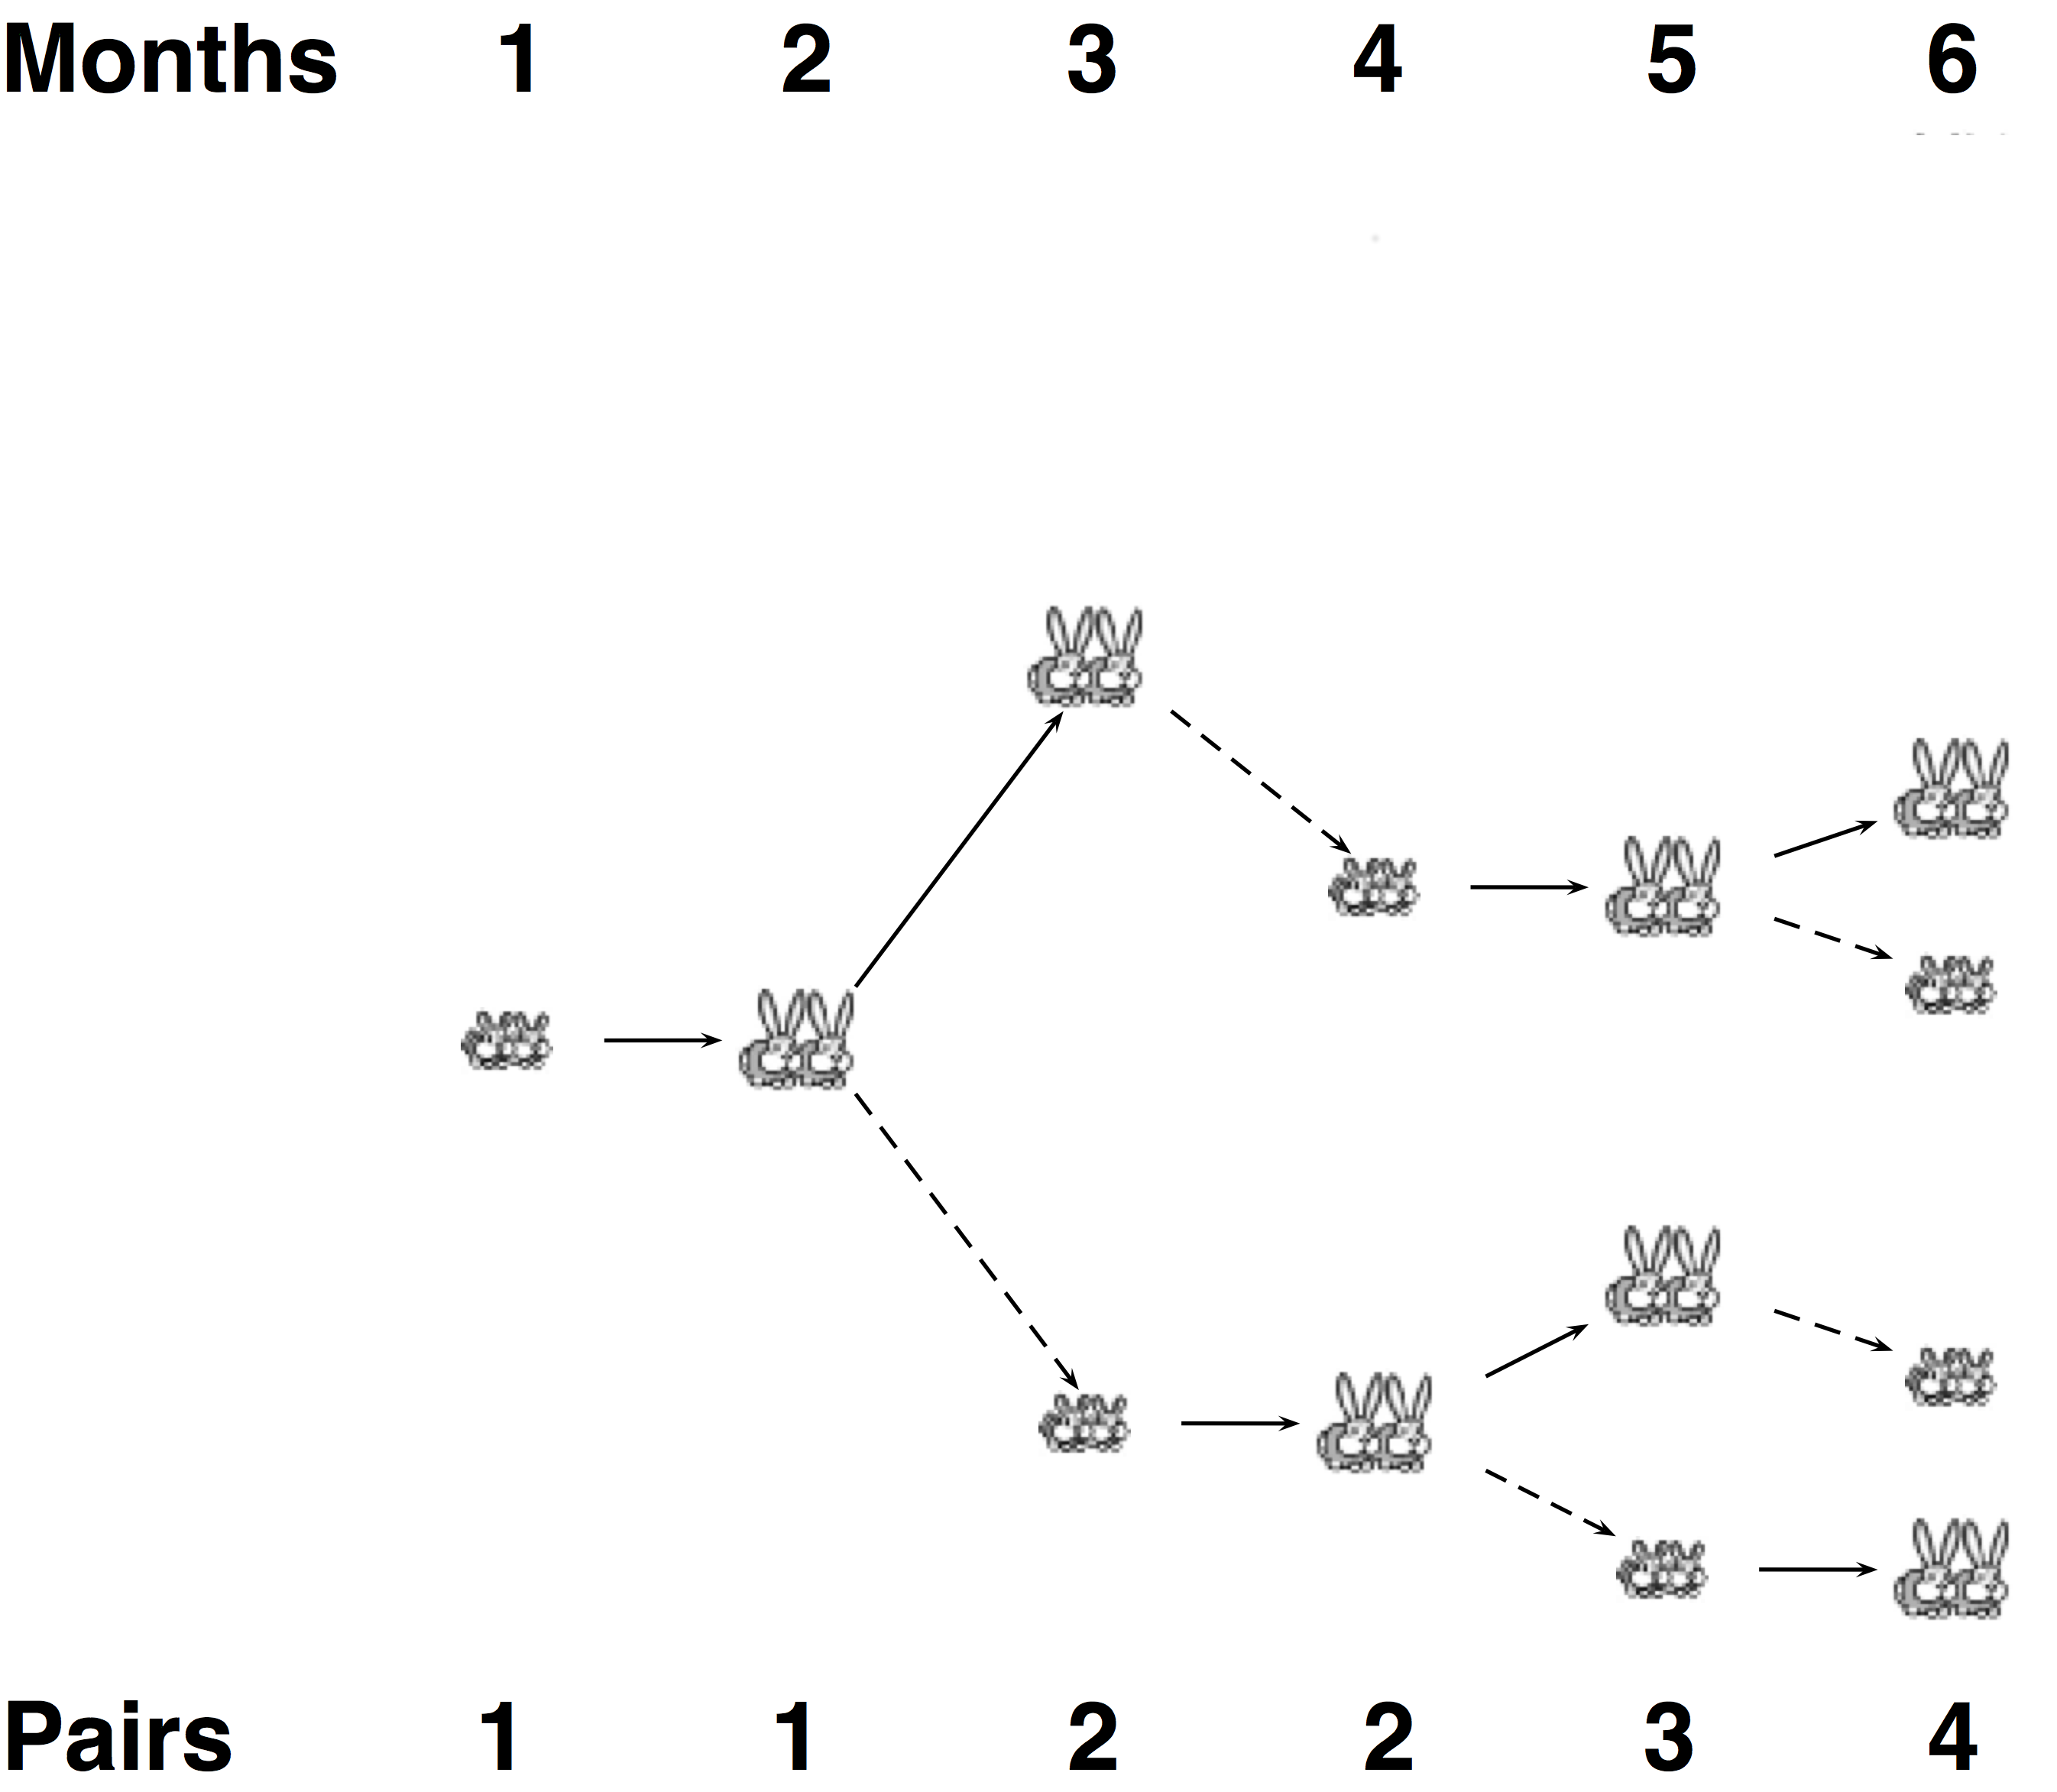
| Mortal Fibonacci Rabbits (0) | 2018.12.05 |
| Consensus and Profile (0) | 2018.12.05 |
| Combing Through the Haystack (0) | 2018.11.30 |